Benchmarks / ITBench-AA
ITBench-AA
Built by Artificial Analysis and IBM Research · released 27 May 2026
Kubernetes incident diagnosis tasks built from IBM's ITBench and run by Artificial Analysis in a fixed agent harness. The model reads an offline incident snapshot with alerts, logs, traces, metrics, and topology, then names the root-cause Kubernetes entities.
Frontier
56.2%
ITBench-AA score
GPT-5.6 Sol (Max) · harness: Stirrup
10 Oct 2026 · Source: Artificial Analysis (benchmark maintainers)
Rank 1 of 45 models on the live board, seen 2026-10-10. Averaged about 31 turns per task. Model release date shown as 2026-07-09; the board does not show the evaluation date. Step 5 Preview (55.6%) and Gemini 3.8 Flash (High) (52.5%) follow. Claude Opus 5.5 (Max, Default Fallback) scores 38.2%.
The best result is at 20–60% of the ceiling, or at 50–100% of human parity.
What it measures
Whether the model finds the exact set of root-cause entities for a Kubernetes incident. Scoring is average precision at full recall: a repeat scores 0 if any true root cause is missed, and otherwise scores the precision of the submitted list. The headline is the mean over 59 tasks and 3 repeats. Models run in the open-source Stirrup harness with shell access and a 100-turn cap.
ITBench-AA score: Mean average precision at full recall over 59 SRE tasks x 3 repeats. Higher is better.
Status compares the frontier with a ceiling of 100%.
Facts
- Grain
- Task level: bounded tasks with a clear spec
- Environment
- cli
- Grading
- state-check
- Tasks
- 59
- Contamination
- 19 of the 59 tasks are new and held out. The other 40 are public ITBench scenarios.
- Reuse
- 40 public tasks are on Hugging Face under CC BY 4.0. The 19 held-out tasks, shared by the ITBench team, are private to Artificial Analysis. (cite-only)
Limits to keep in mind
- Diagnosis only. Models name root-cause entities from a snapshot; they do not repair a live system. Repair is what the original ITBench SRE track scores. Source
- Strict scoring: naming one extra entity lowers the score, and missing one true root cause gives zero for that repeat. Models that investigate longer tend to add false positives. Source
- FinOps and CISO tasks were announced but not yet included at launch. Source
Recorded results
A selection that shows the frontier over time. The full leaderboard is at the source.
| System | ITBench-AA score | Date | Source |
|---|---|---|---|
| GPT-5.6 Sol (Max) · frontier harness: Stirrup | 56.2% | 10 Oct 2026 | Artificial Analysis · primary |
| Gemini 3.1 Pro Preview harness: Stirrup | 30% | 27 May 2026 | Artificial Analysis · primary |
| GLM-5.1 (Reasoning) harness: Stirrup | 40% | 27 May 2026 | Artificial Analysis · primary |
| GPT-5.5 (xhigh) harness: Stirrup | 46% | 27 May 2026 | Artificial Analysis · primary |
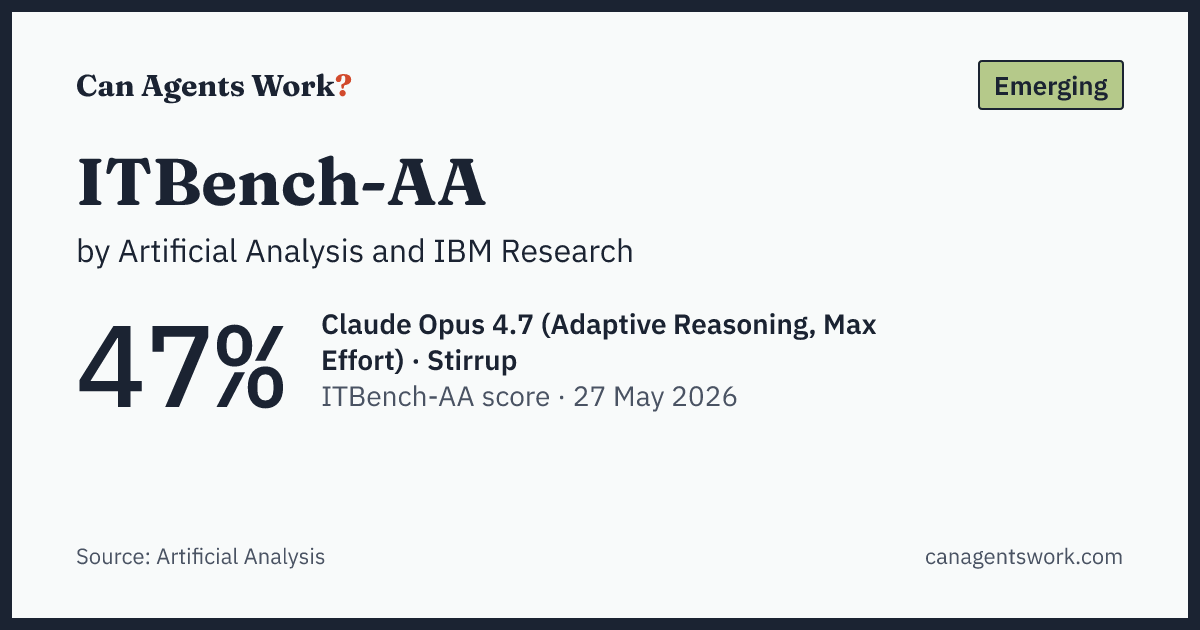
| Claude Opus 4.7 (Adaptive Reasoning, Max Effort) harness: Stirrup | 47% | 27 May 2026 | Artificial Analysis · primary |
Timeline
Where it sits in the atlas
Work ladder: Direct evidence for DevOps, SRE, and IT operations. On the work ladder it counts as 56.2% of tasks completed. How the ladder works
Work it measures (O*NET work activities): Monitor operation of computer or information technologies; Resolve computer problems.
Go to the source
- Website artificialanalysis.ai
- Full leaderboard artificialanalysis.ai
- Announcement artificialanalysis.ai
- Dataset huggingface.co
Last checked 10 Oct 2026 against 4 primary sources. See an error? Tell us.
How to cite
Credit the original work first: ITBench-AA by Artificial Analysis and IBM Research.
Then, if you used this page:
Can Agents Work. "ITBench-AA: frontier results and sources." https://canagentswork.com/benchmarks/itbench-aa/ (accessed 2026-10-11). CC BY 4.0.@misc{caw-itbench-aa,
title = {{ITBench-AA: frontier results and sources}},
author = {{Can Agents Work}},
year = {2026},
howpublished = {\url{https://canagentswork.com/benchmarks/itbench-aa/}},
note = {Accessed 2026-10-11. CC BY 4.0}
}