Can agents work?
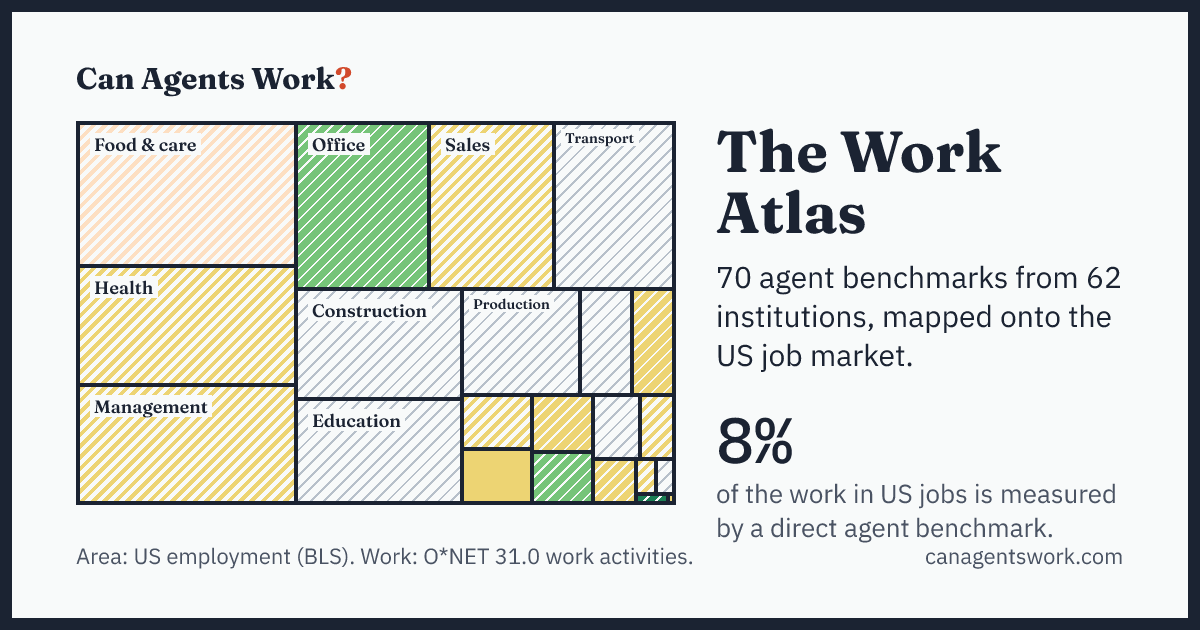
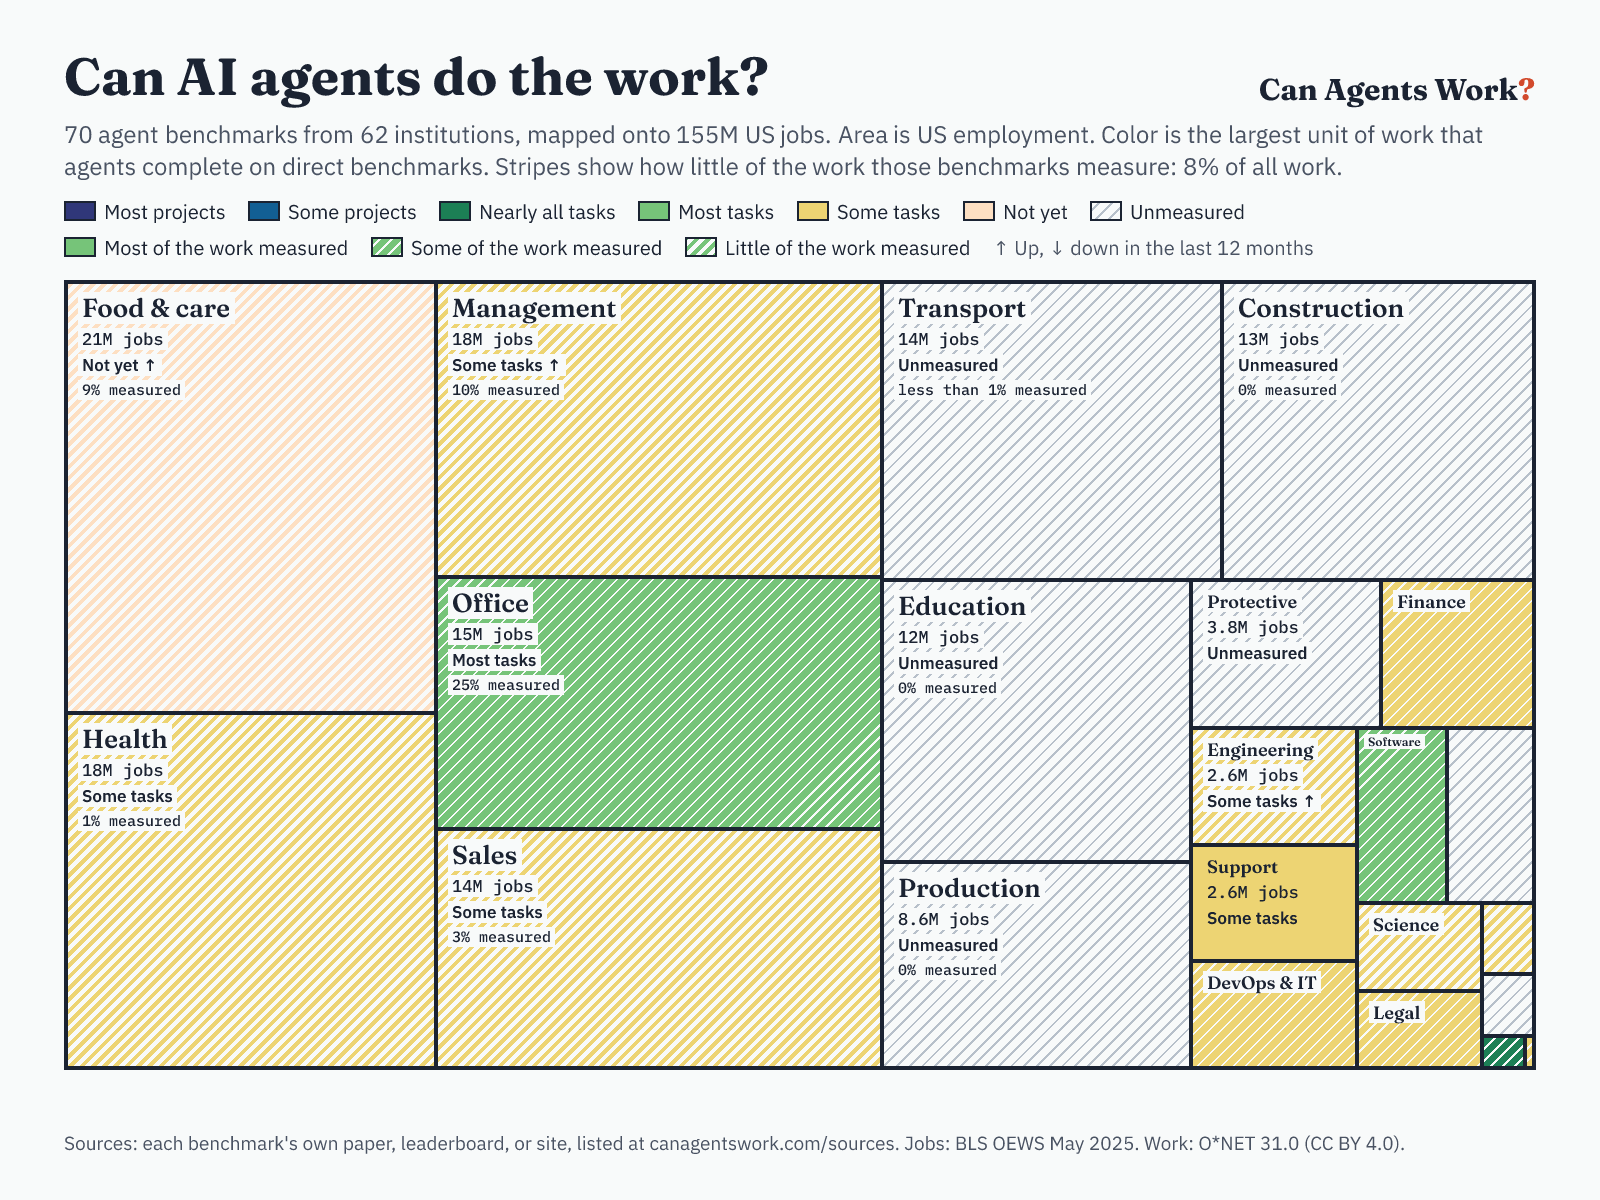
This atlas maps 70 agent benchmarks from 62 institutions onto 997 US occupations. Color shows the largest unit of work that agents complete on direct benchmarks. Stripes show how little of the work those benchmarks measure. Area is US employment.
The Work Atlas
- Food & careNot yet(first measured in the last 12 months)
- HealthSome tasks(no change in 12 months)
- ManagementSome tasks(first measured in the last 12 months)
- OfficeMost tasks(no change in 12 months)
- SalesSome tasks(no change in 12 months)
- TransportUnmeasured(no change in 12 months)
- ConstructionUnmeasured(no change in 12 months)
- EducationUnmeasured(no change in 12 months)
- ProductionUnmeasured(no change in 12 months)
- ProtectiveUnmeasured(no change in 12 months)
- FinanceSome tasks(no change in 12 months)
- EngineeringSome tasks(first measured in the last 12 months)
- SupportSome tasks(no change in 12 months)
- DevOps & ITSome tasks(no change in 12 months)
- SoftwareMost tasks(no change in 12 months)
- Design & mediaUnmeasured(no change in 12 months)
- ScienceSome tasks(no change in 12 months)
- LegalSome tasks(first measured in the last 12 months)
- DataSome tasks(no change in 12 months)
- FarmingUnmeasured(no change in 12 months)
- SecurityNearly all tasks(up from Not yet 12 months earlier)
- ML researchSome tasks(no change in 12 months)
- Food & careNot yet(first measured in the last 12 months)
- HealthSome tasks(no change in 12 months)
- ManagementSome tasks(first measured in the last 12 months)
- OfficeMost tasks(no change in 12 months)
- SalesSome tasks(no change in 12 months)
- TransportUnmeasured(no change in 12 months)
- ConstructionUnmeasured(no change in 12 months)
- EducationUnmeasured(no change in 12 months)
- ProductionUnmeasured(no change in 12 months)
- ProtectiveUnmeasured(no change in 12 months)
- FinanceSome tasks(no change in 12 months)
- EngineeringSome tasks(first measured in the last 12 months)
- SupportSome tasks(no change in 12 months)
- DevOps & ITSome tasks(no change in 12 months)
- SoftwareMost tasks(no change in 12 months)
- Design & mediaUnmeasured(no change in 12 months)
- ScienceSome tasks(no change in 12 months)
- LegalSome tasks(first measured in the last 12 months)
- DataSome tasks(no change in 12 months)
- FarmingUnmeasured(no change in 12 months)
- SecurityNearly all tasks(up from Not yet 12 months earlier)
- ML researchSome tasks(no change in 12 months)
Color: the work ladder
- Most projects · 0% of US jobs
Agents complete 60% or more of whole projects on two direct benchmarks from independent institutions. - Some projects · 0% of US jobs
Agents complete 20% or more of whole projects on two direct benchmarks from independent institutions. - Nearly all tasks · 0% of US jobs
Agents complete 90% or more of the tasks (or projects) on two direct benchmarks from independent institutions. - Most tasks · 11% of US jobs
Agents complete 60% or more of the tasks (or projects) on two direct benchmarks from independent institutions. - Some tasks · 41% of US jobs
Agents complete 20% or more of the tasks (or projects) on a direct benchmark. - Not yet · 14% of US jobs
Direct benchmarks exist, but agents complete less than 20% of their tasks. - Unmeasured · 34% of US jobs
No direct benchmark gives a success rate.
Texture: how much of the work is measured
- Most of the work is measured (50% or more)
- Some of the work is measured (20% to 50%)
- Little of the work is measured (less than 20%)
Coverage is the share of a job family's work, by O*NET work activities, that direct benchmarks test. How we measure it.
Arrow: the last 12 months
A higher step than on 24 Sep 2025, or measured for the first time since then.
A lower step than on 24 Sep 2025, for example after a benchmark was retired.
Area: US employment, BLS OEWS May 2025 (155M jobs). Color and stripes: the work ladder, computed from the direct benchmarks on each family page, with data as of 24 Sep 2026. Work: O*NET 31.0 occupations and work activities. Method.
Full-size atlas image (PNG, 1600 × 1200, with legend and sources): download.
How to cite
Credit the original work first: the benchmarks behind each job family, listed on each family page and at /sources/.
Then, if you used this page:
Can Agents Work. "The Work Atlas: AI agent benchmarks mapped onto US jobs." https://canagentswork.com/ (accessed 2026-09-24). CC BY 4.0.@misc{caw-work-atlas,
title = {{The Work Atlas: AI agent benchmarks mapped onto US jobs}},
author = {{Can Agents Work}},
year = {2026},
howpublished = {\url{https://canagentswork.com/}},
note = {Accessed 2026-09-24. CC BY 4.0}
}Can agents do my job?
Job families
| Family | US jobs | Step | Work measured | Last 12 months | Direct benchmarks |
|---|---|---|---|---|---|
| Food service, cleaning, and personal care | 21M | Not yet | 9% | First measured | 1 |
| Healthcare | 18M | Some tasks | 1% | No change | 3 |
| Management and business operations | 18M | Some tasks | 10% | First measured | 3 |
| Office and administrative support | 15M | Most tasks | 25% | No change | 5 |
| Sales and marketing | 14M | Some tasks | 3% | No change | 1 |
| Transportation and material moving | 14M | Unmeasured | less than 1% | No change | 1 |
| Construction, installation, and repair | 13M | Unmeasured | 0% | No change | 0 |
| Education and social services | 12M | Unmeasured | 0% | No change | 0 |
| Production and manufacturing | 8.6M | Unmeasured | 0% | No change | 0 |
| Protective service | 3.8M | Unmeasured | 0% | No change | 0 |
| Finance and accounting | 3.1M | Some tasks | 34% | No change | 4 |
| Architecture and engineering | 2.6M | Some tasks | 3% | First measured | 2 |
| Customer support | 2.6M | Some tasks | 57% | No change | 1 |
| DevOps, SRE, and IT operations | 2.4M | Some tasks | 21% | No change | 5 |
| Software engineering | 2.2M | Most tasks | 47% | No change | 9 |
| Design, media, and writing | 2.0M | Unmeasured | 0% | No change | 0 |
| Science and research | 1.5M | Some tasks | less than 1% | No change | 1 |
| Legal | 1.3M | Some tasks | 41% | First measured | 3 |
| Data and analytics | 500K | Some tasks | 8% | No change | 2 |
| Farming, fishing, and forestry | 434K | Unmeasured | 0% | No change | 0 |
| Security | 191K | Nearly all tasks | 35% | Up from Not yet | 7 |
| ML and research engineering | 37K | Some tasks | 23% | No change | 3 |
Latest on the frontier
- 24 Sep 2026The atlas moves to the work ladder and coverage (method 2)
- 22 Sep 2026Muse Spark 1.2 completes 25.42% of Harvey LAB held-out tasks on the Vals AI board
- 22 Sep 2026SWE-Bench Pro V2 launches with 642 validated tasks and a locked offline protocol
- 22 Sep 2026SWE-Bench Pro V2 is saturated at launch: Opus 5 with Claude Code resolves 99.4%
- 22 Sep 2026Scale AI replaces the SWE-Bench Pro public board with V2; the V1 board moves to Legacy
- 21 Sep 2026gNucleus AI releases Parametric CAD Bench V3; GPT-6 Astra with Codex leads at 56.87%
Recent frontier results
- 1735 EloDreamZero (dreaming_zebra) · 24 Sep 2026Unrated
- 1846 EloClaude Opus 5.5 (Adaptive Reasoning, Max Effort, Default Fallback) · 23 Sep 2026Unrated
The atlas stands on their work
Every benchmark here was built by someone else. We summarize, map, and link. Start with their work.
aavetisAfterQueryAI Security InstituteAi2AiderAmazonAndon LabsAnthropicApturaARPA-HArtificial AnalysisBoxCAISCarnegie Mellon UniversityCisco ResearchConcordia UniversityCrosby LegalDARPADexmalEVAL SYSgNucleus AIGoogle CloudGray Swan AIHarveyHKUHugging FaceIBM ResearchIIScLaude InstituteLobeHubMartianMercorMetaMETRmicro1Microsoft ResearchMilaNebiusNUS TRAILOpenAIPeking UniversityPrinceton UniversityQueen's UniversityRampReflectionRenmin University of ChinaSalesforce AI ResearchScale AIServiceNowShortcutSierraSnorkel AIStanford UniversityUC BerkeleyUIUCUniversité de MontréalUniversity of MichiganUniversity of TorontoUniversity of WaterlooVals AIWaymoZapier