Benchmarks / Waymo Safety Impact data hub
Waymo Safety Impact data hub (Waymo Safety Impact)
Built by Waymo · released 5 Sep 2024
Waymo's public record of how its driverless ride-hailing fleet crashes compared with human drivers. It counts crashes reported to NHTSA under the Standing General Order during rider-only driving (no human behind the wheel) and compares the rates per million miles with human benchmarks built from state crash and mileage data for the same roads and areas.
Frontier
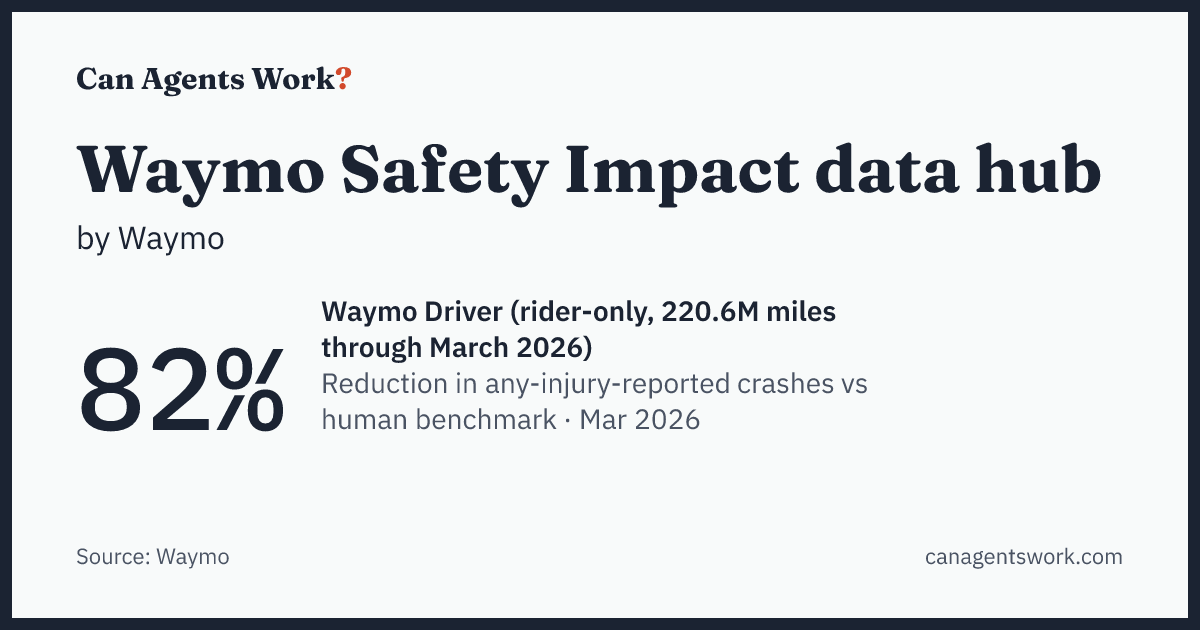
82%
Reduction in any-injury-reported crashes vs human benchmark
Waymo Driver (rider-only, 220.6M miles through March 2026) · agent: Waymo Driver
Mar 2026 · Source: Waymo (reported by the system's developer)
Hub release of 2026-06-24, data through March 2026: "82% fewer injury-causing crashes (707 fewer)". CSV3 gives the unrounded values: 156 Waymo crashes, 0.7071 per million miles against a benchmark of 3.9137, reduction 81.93% (95% CI 78.40% to 85.02%) over 220.613 million rider-only miles. Same release: 94% fewer serious-injury-or-worse crashes (3 events, 47 fewer) and 82% fewer any-airbag-deployment crashes (66 events, 305 fewer).
No fixed reference point (for example Elo scores or field signals).
What it measures
Crash rates of the Waymo Driver while carrying out its work: driving passengers on surface streets in Phoenix, the San Francisco Bay Area, Los Angeles, Austin, and Atlanta. Through March 2026 the fleet drove 220.6 million rider-only miles. The headline is any-injury-reported crashes: 156 crashes, or 0.71 per million miles, against 3.91 per million miles for human drivers on the same distance, a reduction of 82% (95% CI 78% to 85%). Serious-injury-or-worse crashes fell 94% (3 events) and crashes with any airbag deployment fell 82%. Rates count all crashes regardless of who was at fault.
Reduction in any-injury-reported crashes vs human benchmark: Percent fewer any-injury-reported crashes per million rider-only miles than human drivers would have over the same distance in the same areas. 0 means human parity; 100 means no crashes. Higher is better.
No fixed reference point, so we do not rate its status. Field signal from the company about its own driver, with a human line at 0% reduction. The site shows no status band for it.
Facts
- Grain
- Task level: bounded tasks with a clear spec
- Environment
- live-system, field-data
- Grading
- outcome-metric, field-signal
- Human reference
- Human drivers in the same counties, adjusted to where the Waymo fleet drives: 3.91 any-injury-reported crashes per million miles (dynamic benchmark, calendar year 2022 data). Waymo: 0.71.
- Reuse
- No license stated on the hub or in the CSV downloads. (cite-only)
Limits to keep in mind
- Waymo reports on its own driver. The method is peer reviewed (Kusano et al. 2025, Traffic Injury Prevention, 56.7 million miles) but the crash counts, mileage, and benchmark choices come from the company. Source
- Safety is one part of a driver's job. The hub does not measure trips completed, pickup times, or passenger service. Source
- Surface streets only, in five metro areas where Waymo chooses to operate. The human benchmarks use police-reported crash data from calendar year 2022 and are reweighted to where the fleet drives. Source
- Definitions have changed over releases (for example the any-injury-reported rule in October 2024 and the SGO Amendment 3 reporting thresholds in June 2025), so values from older releases are not exactly comparable. Source
Recorded results
A selection that shows the frontier over time. The full leaderboard is at the source.
Timeline
Where it sits in the atlas
Work ladder: Direct evidence for Transportation and material moving, but it is a field study of real deployments. It adds to the work measured, but it cannot set a step. How the ladder works
Work it measures (O*NET work activities): Operate transportation equipment or vehicles.
Go to the source
Last checked 24 Sep 2026 against 5 primary sources. See an error? Tell us.
How to cite
Credit the original work first: Waymo Safety Impact data hub by Waymo (https://www.tandfonline.com/doi/full/10.1080/15389588.2025.2499887).
Then, if you used this page:
Can Agents Work. "Waymo Safety Impact data hub: frontier results and sources." https://canagentswork.com/benchmarks/waymo-safety-impact/ (accessed 2026-09-24). CC BY 4.0.@misc{caw-waymo-safety-impact,
title = {{Waymo Safety Impact data hub: frontier results and sources}},
author = {{Can Agents Work}},
year = {2026},
howpublished = {\url{https://canagentswork.com/benchmarks/waymo-safety-impact/}},
note = {Accessed 2026-09-24. CC BY 4.0}
}