Jobs / Data and analytics
Can agents do data and analytics work?
Query, clean, analyze, and model data; statistics and operations research.
- US jobs
- 499,540 (0.3% of employment)
- Typical wage
- $115K a year (employment-weighted mean of occupation medians)
- Occupations
- 13 in O*NET 31.0
- Evidence
- 5 benchmarks from 8 institutions
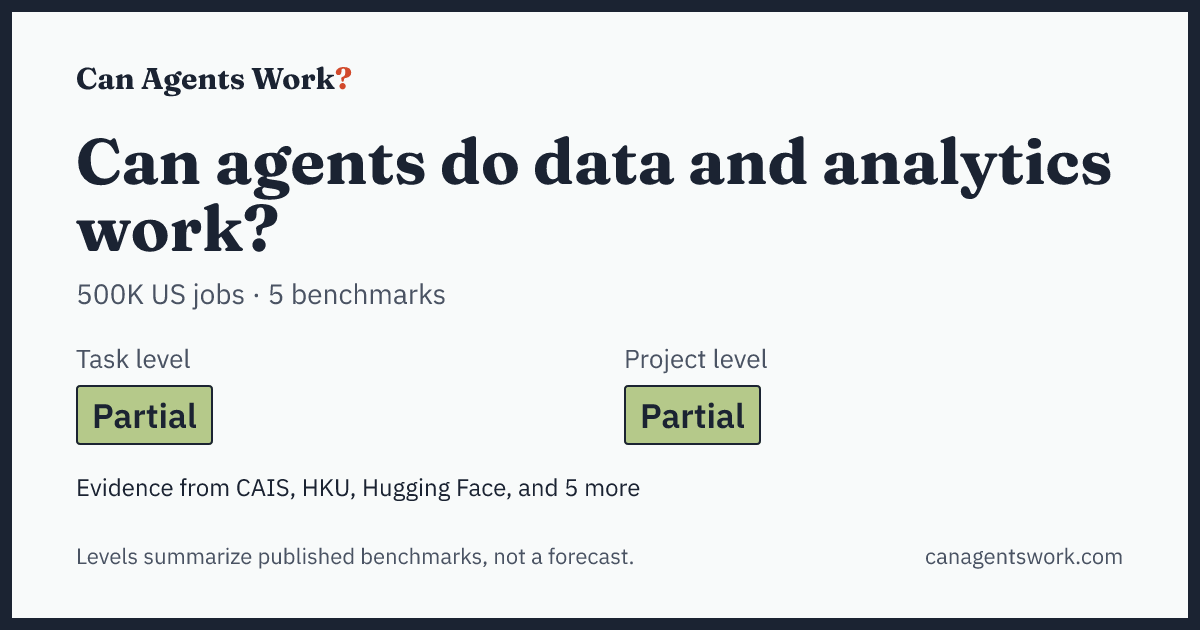
Task level
Partial
One direct benchmark, near its ceiling. On Spider 2.0-Snow, which asks for multi-step SQL against large business databases, the top agent reaches 96.7% execution accuracy, but the entry names no model. Adjacent spreadsheet tasks agree (83.1% on SpreadsheetBench). No benchmark in our collection tests open-ended analysis, where the right question is itself unclear.
Evidence: Spider 2.0, SpreadsheetBench, GAIA — by HKU, Hugging Face, Meta, Renmin University of China, and Salesforce AI Research. Reading dated 23 Sep 2026.
Agents succeed on some scoped tasks. Reliable or end-to-end work is not shown.
Project level
Partial
Mixed, adjacent evidence. On MLE-bench, 75 offline Kaggle competitions, the best agent wins a medal in 64.4% of competitions. The Remote Labor Index includes data analysis projects; across all its projects, the best agent completed 15.8% to a standard a client would accept.
Evidence: MLE-bench, Remote Labor Index — by CAIS, OpenAI, and Scale AI. Reading dated 23 Sep 2026.
Agents succeed on some scoped tasks. Reliable or end-to-end work is not shown.
Benchmarks for this work
- 96.7%Genloop's Sentinel Agent v2 Pro · 1 Mar 2026Saturated
Also relevant
These benchmarks cover part of this family's work.
Functions: Web researchML engineeringFreelance projectsProfessional deliverablesData engineering and SQLSpreadsheet work
What we do not know
- Benchmarks measure tasks, not whole jobs. A job is a bundle of tasks, judgment, and relationships.
- Capability is not adoption. A task that agents can do in a benchmark may still be done by people at work.
- Most results come from single runs. Reliability over many runs is often unknown.
Occupations in this family
Sorted by US employment (BLS OEWS May 2025). O*NET sub-occupations share the employment figure of their SOC group.
| Occupation | SOC | US jobs |
|---|---|---|
| Geographic Information Systems Technologists and Technicians | 15-1299.02 | (435K group) |
| Business Intelligence Analysts | 15-2051.01 | (262K group) |
| Clinical Data Managers | 15-2051.02 | (262K group) |
| Data Scientists | 15-2051.00 | 262K |
| Operations Research Analysts | 15-2031.00 | 109K |
| Data Warehousing Specialists | 15-1243.01 | (67K group) |
| Database Architects | 15-1243.00 | 67K |
| Biostatisticians | 15-2041.01 | (29K group) |
| Statisticians | 15-2041.00 | 29K |
| Actuaries | 15-2011.00 | 27K |
| Bioinformatics Technicians | 15-2099.01 | (4K group) |
| Mathematical Science Occupations, All Other | 15-2099.00 | 4K |
| Mathematicians | 15-2021.00 | 2K |
How to cite
Credit the original work first: the benchmarks listed on this page, and their institutions.
Then, if you used this page:
Can Agents Work. "Can agents do data and analytics work?." https://canagentswork.com/jobs/data-analytics/ (accessed 2026-09-24). CC BY 4.0.@misc{caw-jobs-data-analytics,
title = {{Can agents do data and analytics work?}},
author = {{Can Agents Work}},
year = {2026},
howpublished = {\url{https://canagentswork.com/jobs/data-analytics/}},
note = {Accessed 2026-09-24. CC BY 4.0}
}